Posts

Showing posts from May, 2018

How to diversify your cryptocurrency portfolio/fund ,Money management, Risk Management.

Ans:- let's assume you have 200$ and you want to trade/invest in cryptocurrency, Then you buy worth 200$ of Bitcoin . Let me tell you something that's biggest mistake of your life because you play ALL IN in BTC and then BTC can Vanish your fund like 'Thanos ' snapping his fingers and "BAM" . So in that condition what you can do like 'Avengers' answer is simple you can diversify your fund in different manners, Below are few tips and Example to diversify :- Tips:- 1:- Always keep backup money if you incurs in loss.  2:- Learn about trading at least basics. 3:- If you want to invest in crypto for short period then forget about investing in crypto,I strongly recommended that investment in crypto is for long purpose only like 1-10 years. 4:- For long term Purpose Buy in ladder and sell in ladder. 4:- Always figure out your Risk-Reward ratio 3:- Always invest those money you can afford to loose. Example of Money Management in cryptocurrency:- 1...
MARUBOZU CANDLESTICK

Image
MARUBOZU CANDLE The   Marubozu  candlestick pattern is a one-candle, easy-to-spot signal with a very clear meaning. It comes in both a bearish (red or black) and a bullish (green or white) form, and it commands attention with its long and sturdy shape. To learn more about how Marubozu candlesticks form, why they form, and what they can tell you about the current state of the market. Formation It doesn’t get any simpler than this! Even the Doji , that tiny little sprite, isn’t easier to spot than the Marubozu . If you think you’ve found a  Marubozu candlestick pattern, look for the following criteria: First,  the single candle involved in the signal should have a long real body.  Second,  there must not be an upper or a lower wick (a.k.a., a shadow). That’s all there is to it!  You’re looking for a big block without any extraneous limbs or extensions. The signal can be white/green or black/red, and it can appear anywhere on the chart...

What is Candlestick ?

Image
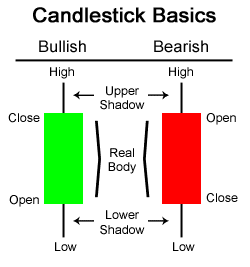
Traders of Crypto-currency and other financial markets often use candlesticks as a great visual aid to what a particular price has done within a certain time period.Candlesticks are formed by showing a candle “body”, a solid area between the open and close price, and “wicks”, which represent the high and low. Sometimes a solid candle can be formed when the open was the low and the close was the high, and thin candles with less of a solid body can be formed when a price is volatile and ranges a lot within the day.Candlesticks can also give clues to price action and the mood of the market towards a certain stock or index. For example, bullish candles form when a market goes up, moves lower, tests support, then springs back to close at a high.Many charting platforms recognize candles and can screen stocks to pull up candidates for a trade. But without solely relying on this technology, it’s a good idea to wrap your head around what these patterns look like.Let’s take a look at four of t...